Your low-code, high impact, data medium
Remove the barrier between SQL-people and non-SQL people

“I introduced the relevant tables, and from there, our sales team was able to build beautiful dashboards on their own. The ease of use is honestly spectacular. It saved me time, empowered the team to self-serve their data, and reduced the back-and-forth usually involved in reporting. Count has made the handoff between data and business teams feel seamless”
Drag and drop answers
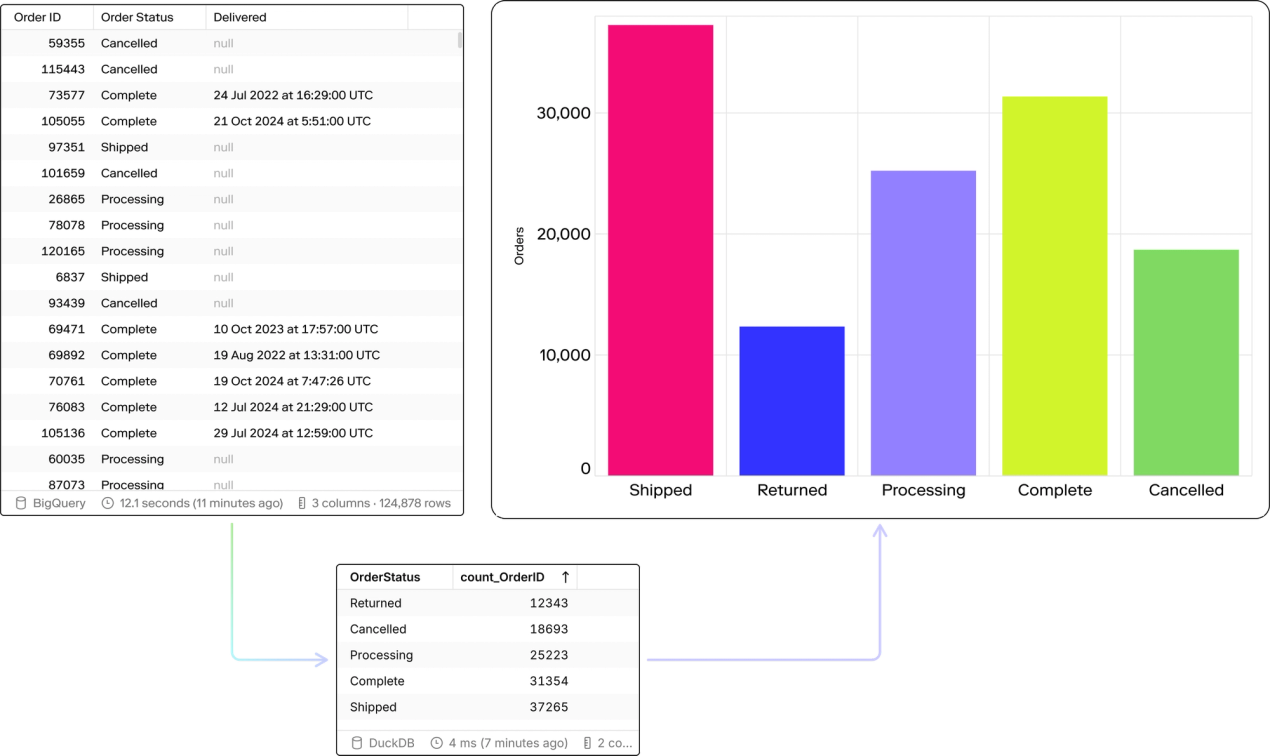
Count Metrics lets data teams fix aggregations and definitions, so the entire company can work with meaningful metrics, in a responsive, drag-and-drop way. Create tables and visualisations to explore data without the risk of misrepresenting it.
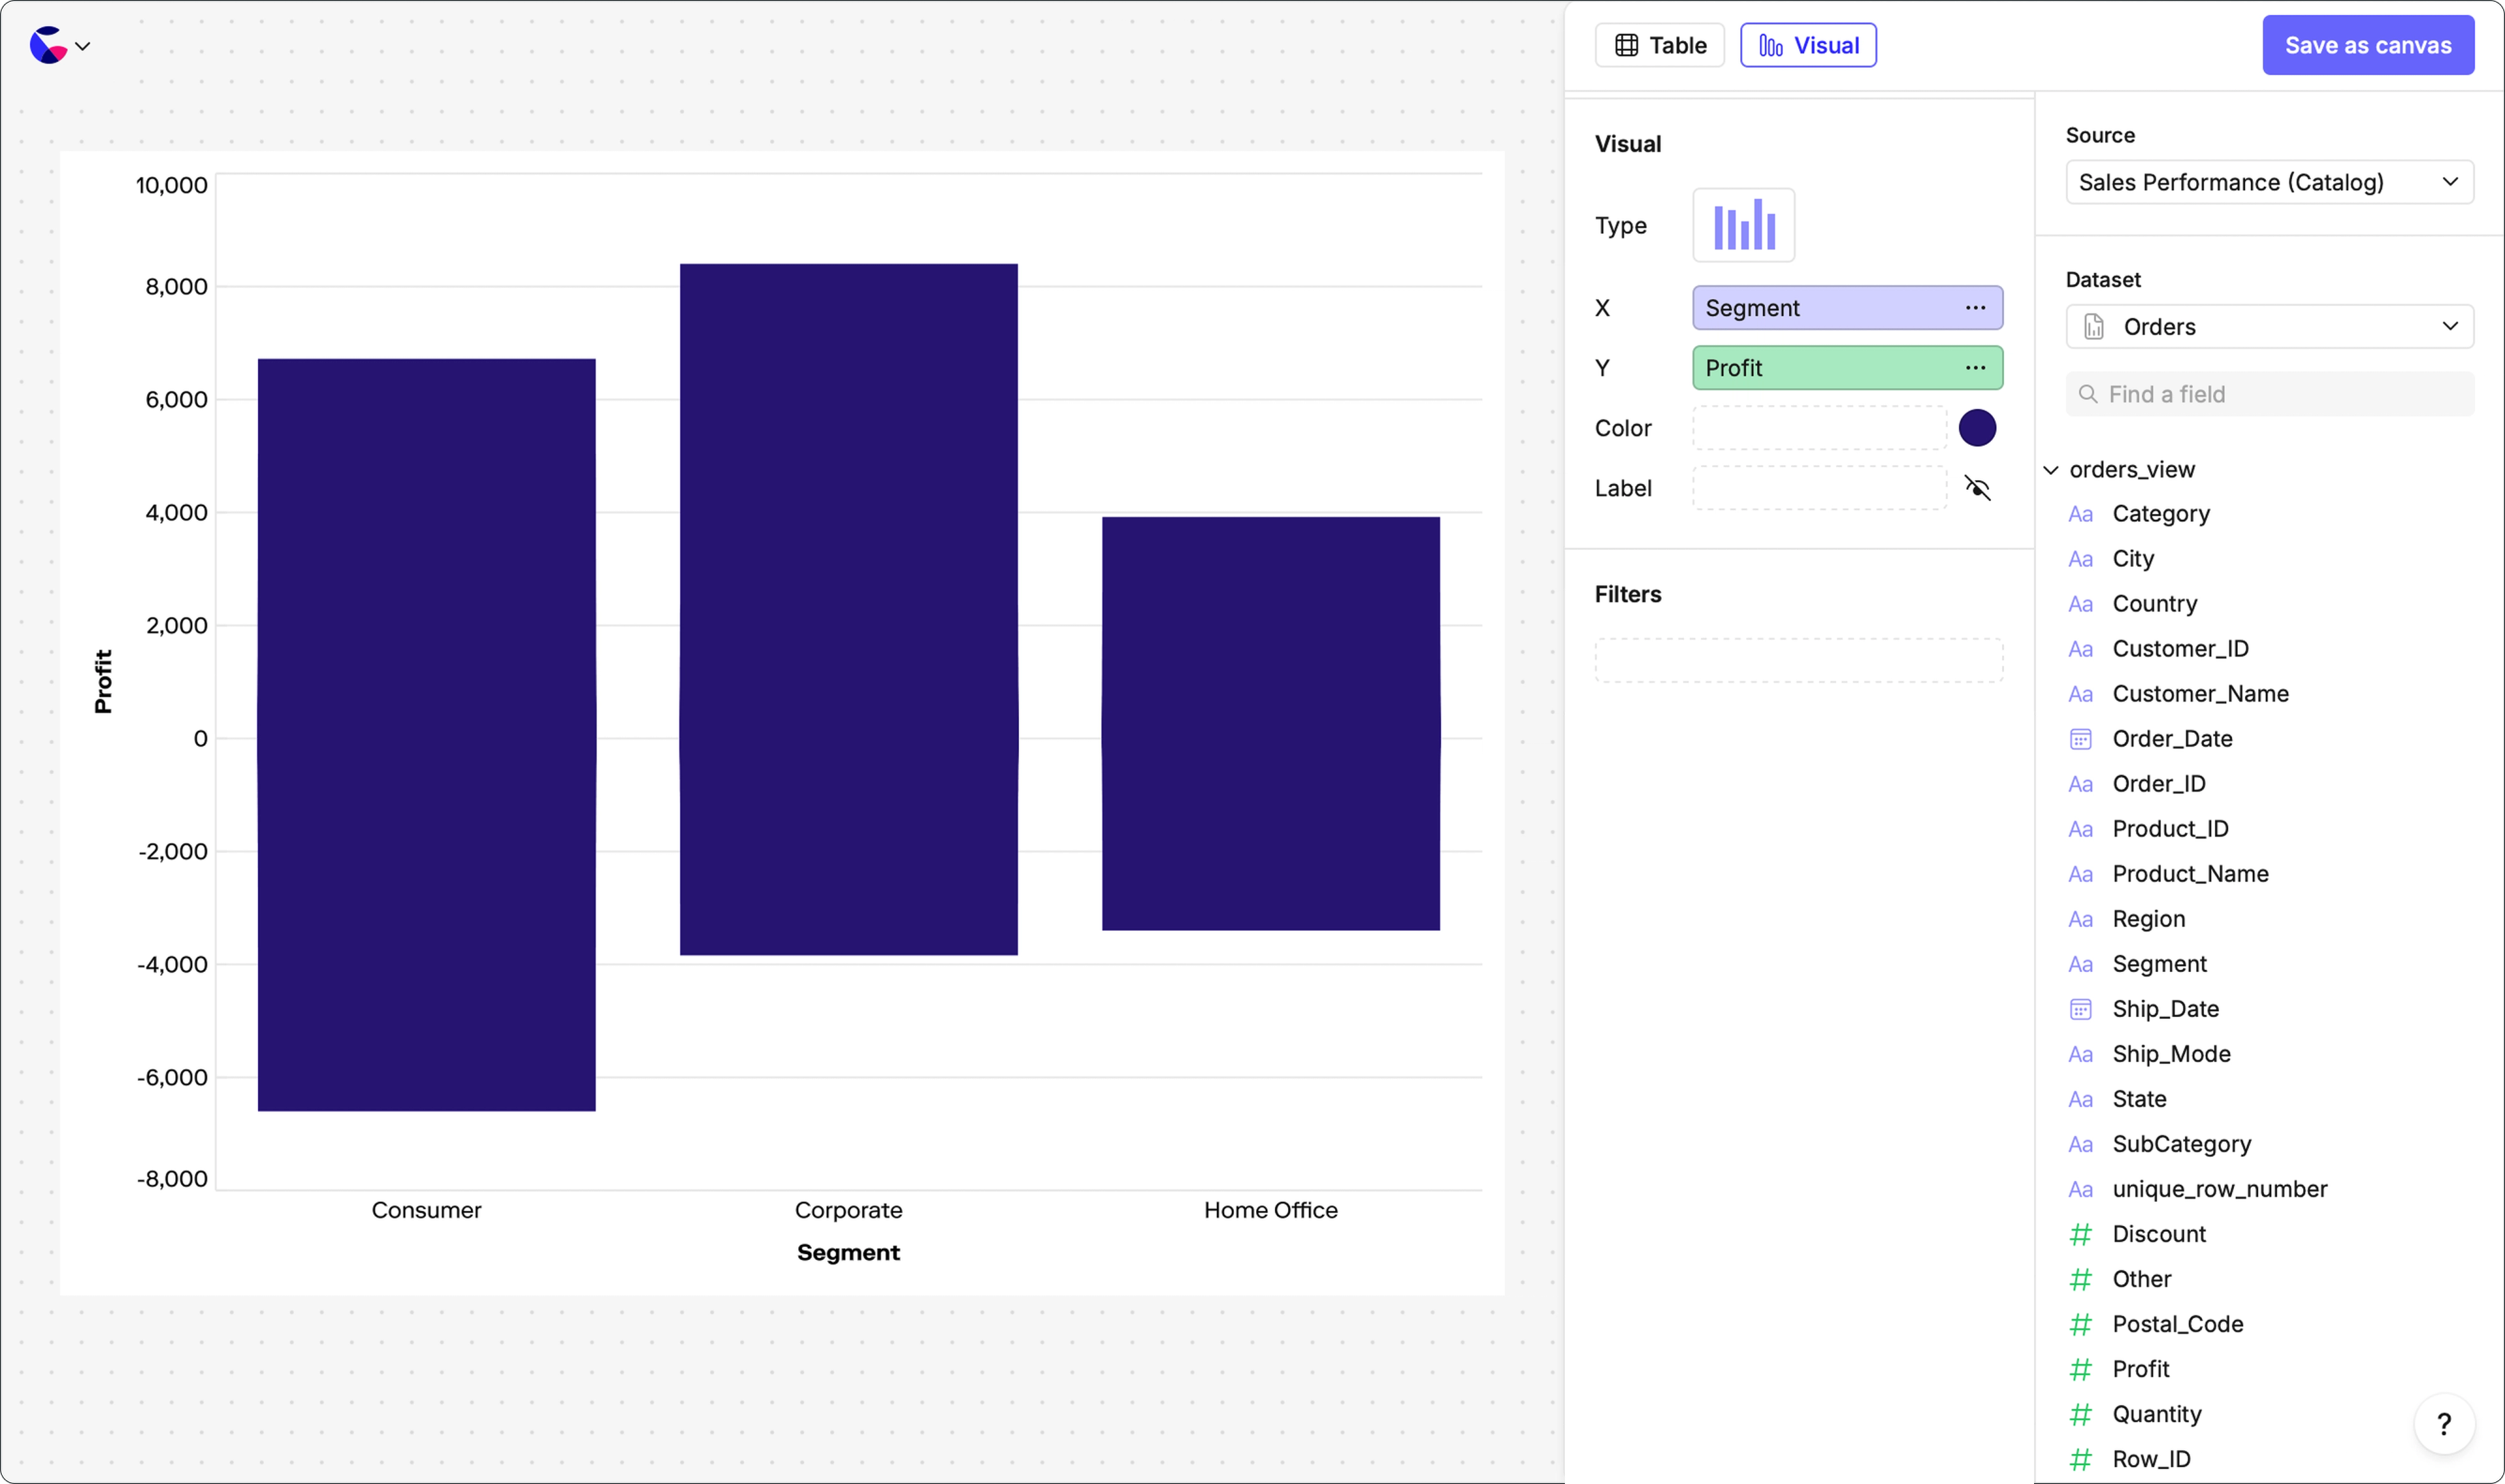
Limitlessly beautiful visuals
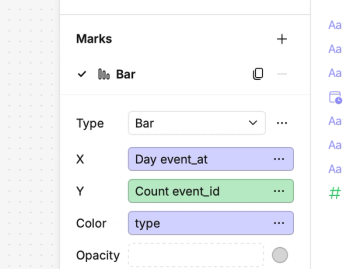
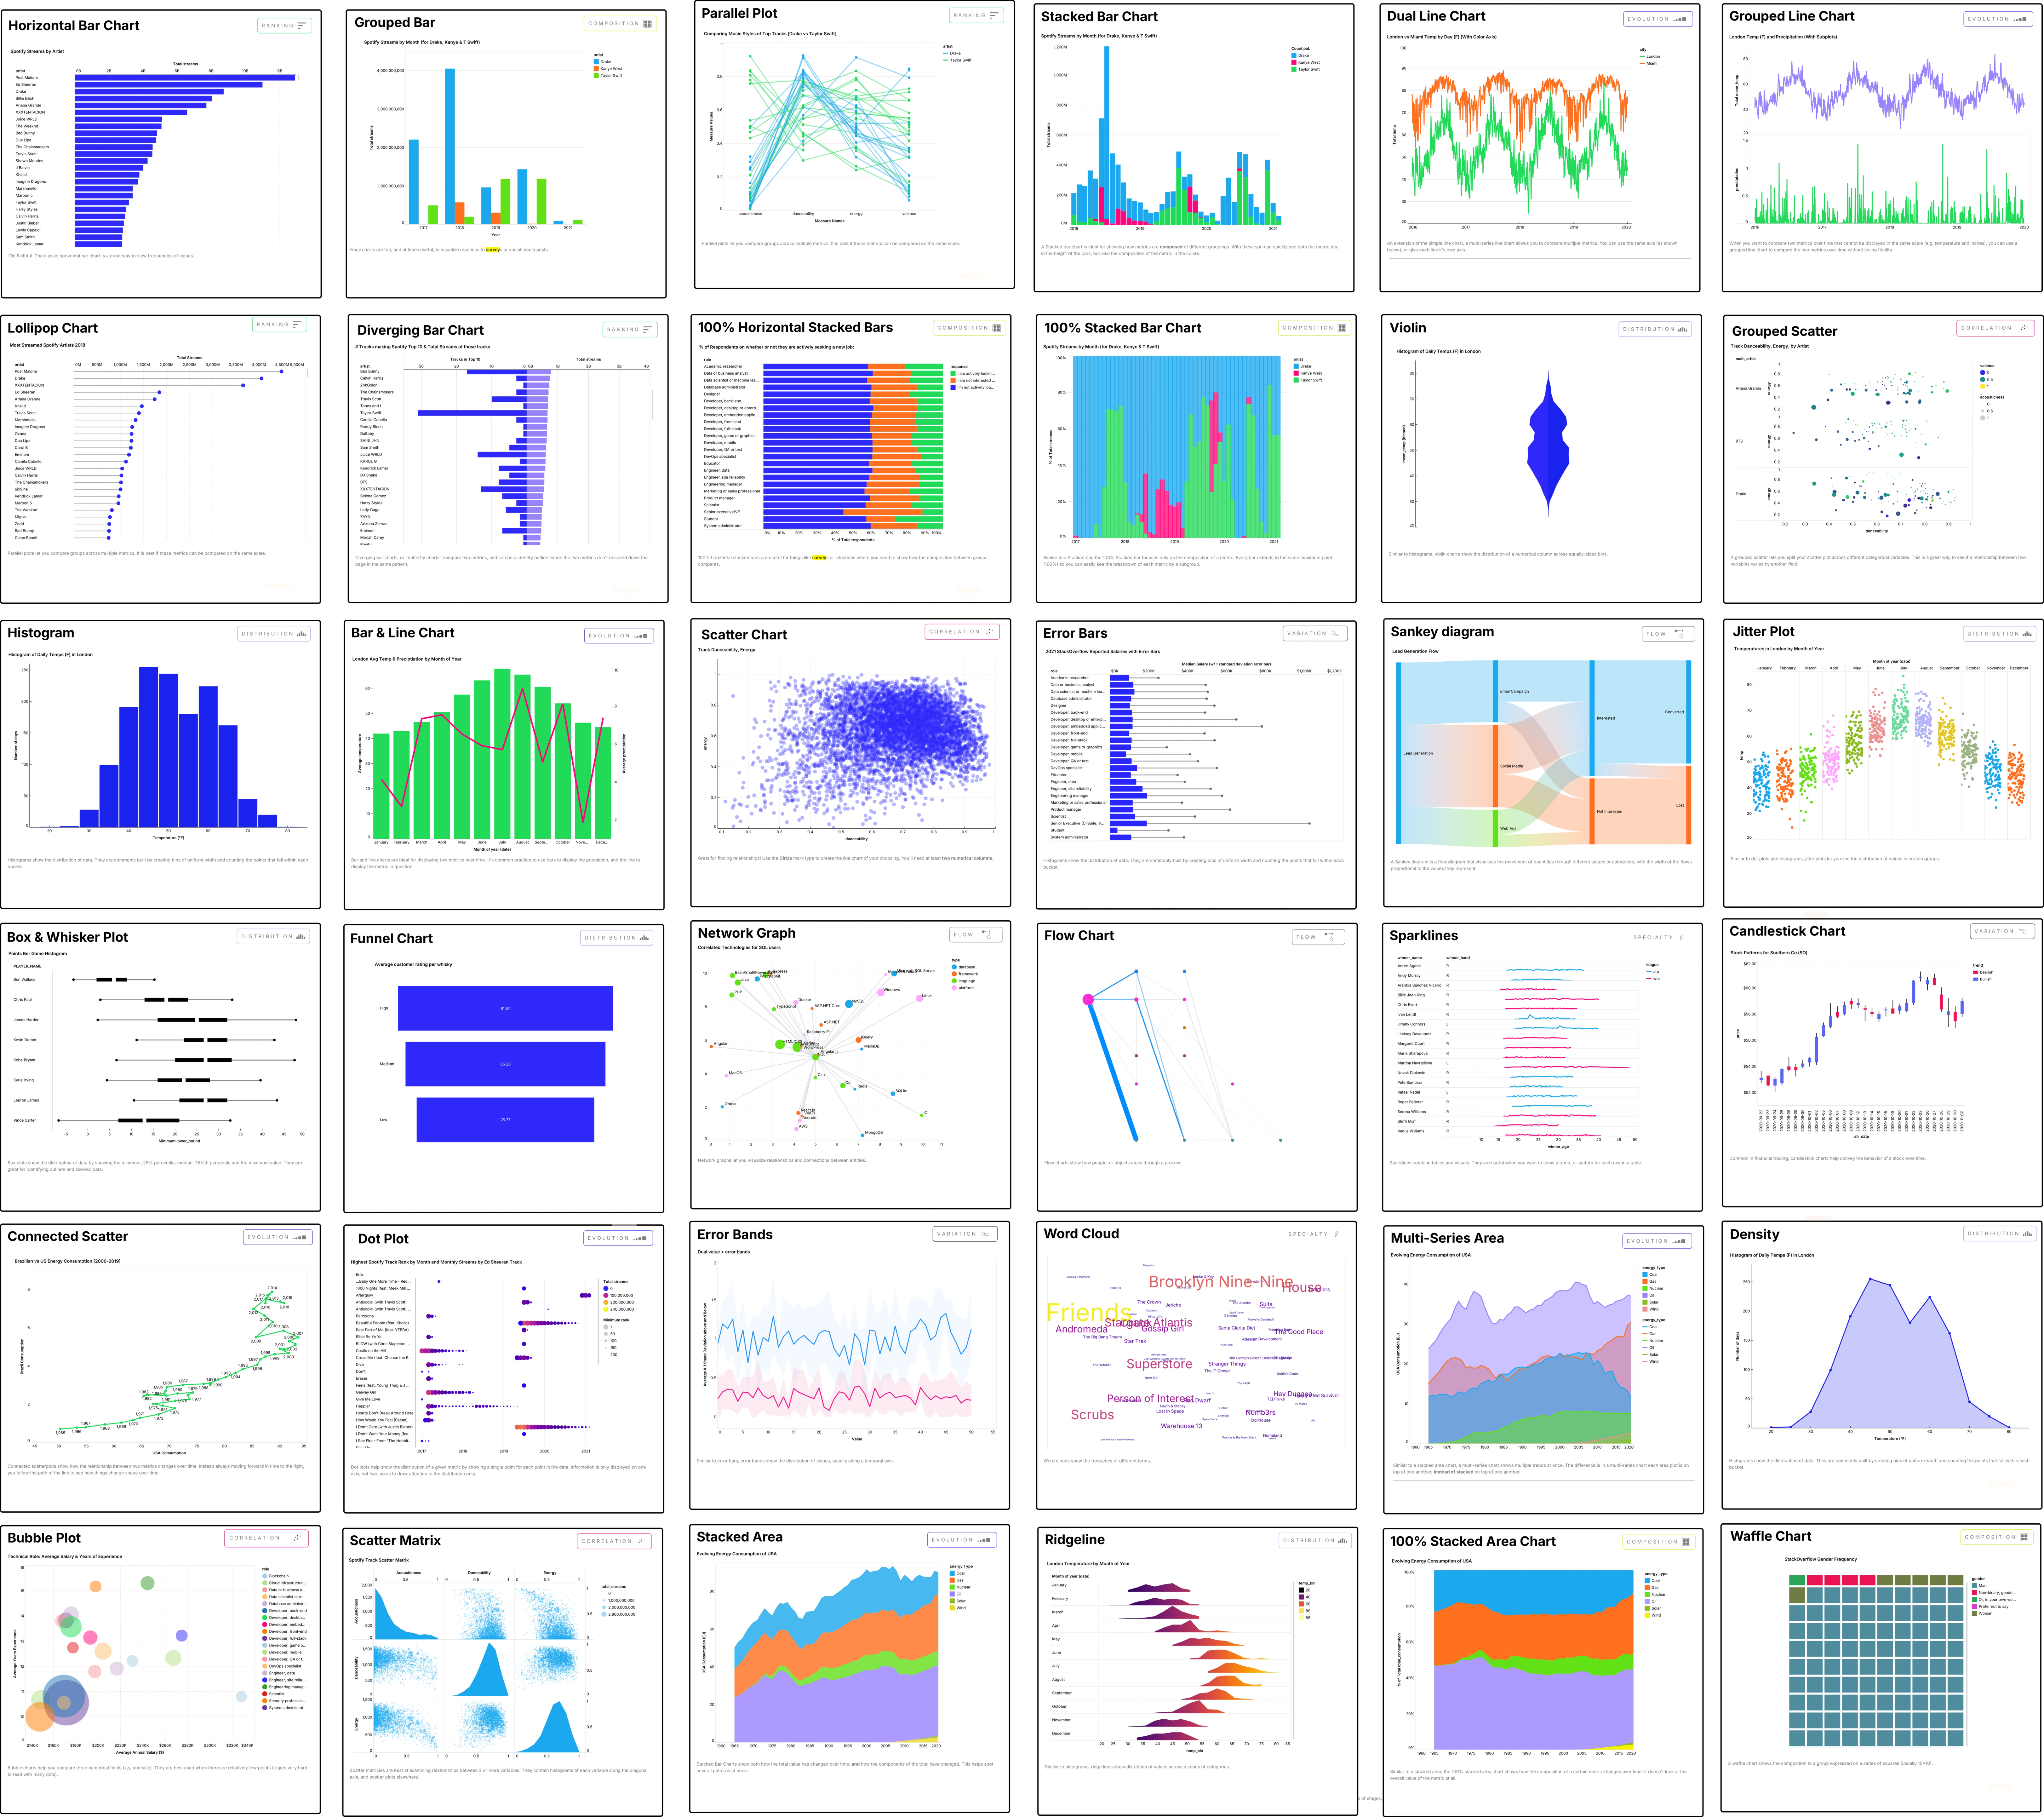
Use drag and drop to create powerful visualisations quickly, or stack different marks with fine-grain styling controls to craft the best way of landing your point.
Siloed data? JOIN the party
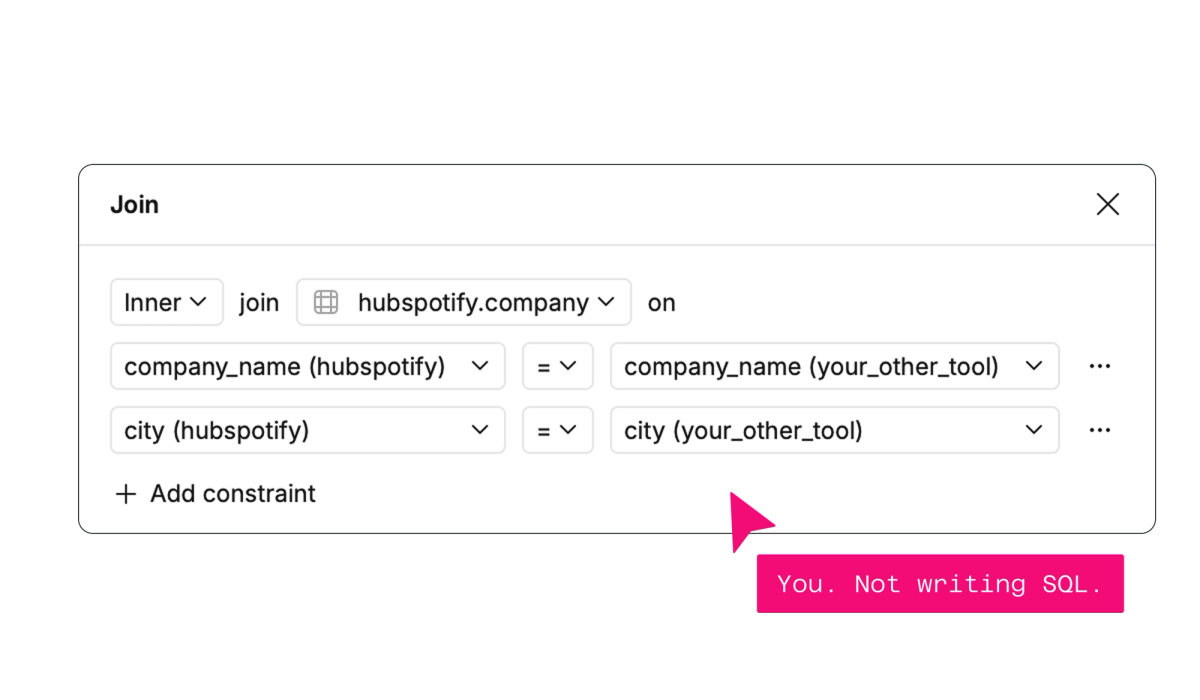
Any cells in the canvas can be joined without ever writing a line of SQL. Liberate data from your entire tool stack and connect it to solve the problems that always seemed, well, disconnected.
You don't have to be an analyst to Explore
Make self-serve a reality for your entire organization, without drowning in spaghetti SQL. Give Explorers a stripped-back, standalone environment to explore your Count Metrics catalogs and answer their own questions.
And everything your teams are missing out on
Caching to keep exploration quick and compute-cheap

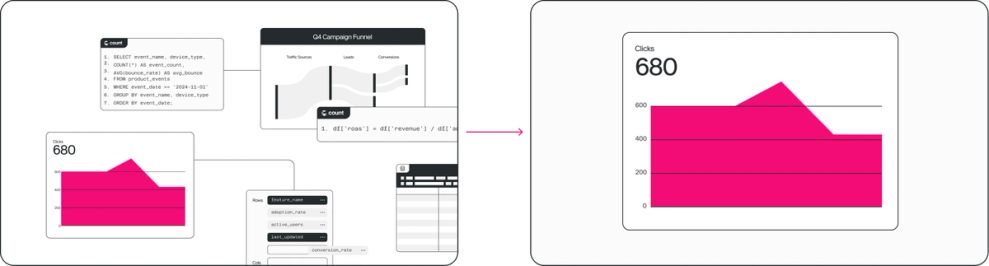
Custom calculations give you all the tools you need to go deeper in visuals

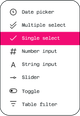
Make canvases interactive with filters and control cells
Zoom in to explore visuals further in a temporary playground
Build the most complex visualizations the simplest way

Peer into any no-code cell to review the SQL behind it

Related Resources
Frequently Asked Questions
We're strong believers that making data more accessible with more clarity for more people underpins the improvement cycle. This hasd driven the way we have built Count's canvas, reporting, analysis, and monitoring functionality. You might know it by other names, agile if you are in product, DMAIC if you did Six Sigma etc., but fundamentally business problems are best solved when they are identified proactively, when they explored using data, when teams can collaborate and make informed decisions faster, and when effective organizational monitoring is put in place, rather than quickly just forgotten dashboards.
Count is used by countless customers to solve exactly these challenges in ways that traditional data analysis tools can't.
Firstly, Count supports all the traditional BI workflows you might be familiar with. You can have reports and data sent via email or Slack on a schedule or when a trigger occurs like a value exceeding a defined threshold.
Where Count is different however, is in its ability to bring metrics to life and put them in the context of business operations, processes, and improvement cycles. Stakeholders can see entire business functions or systems on canvases, dive into elements of interest with no-code analysis tools, and collaborate asynchronously with discussion threads and sticky notes, or in real time.
Count helps analysts and wider data teams get out of the cycle of fielding ad-hoc requests and building dashboards and into impactful collaboration around their data.
Yes, through Explorer roles and low-code/visual cells. Explorers can use drag-and-drop functionality on pre-built datasets from Count Metrics (the semantic layer) to create their own analyses without writing SQL, while analysts maintain governance through the semantic layer.
Count canvases are multiplayer environments where everyone sees all changes as they happen. You can add comments, sticky notes, and collaborate synchronously or asynchronously. Canvases can be locked to prevent changes while viewing, and you can duplicate and merge for safe editing.