Make sure everyone understands how the organization works and grows
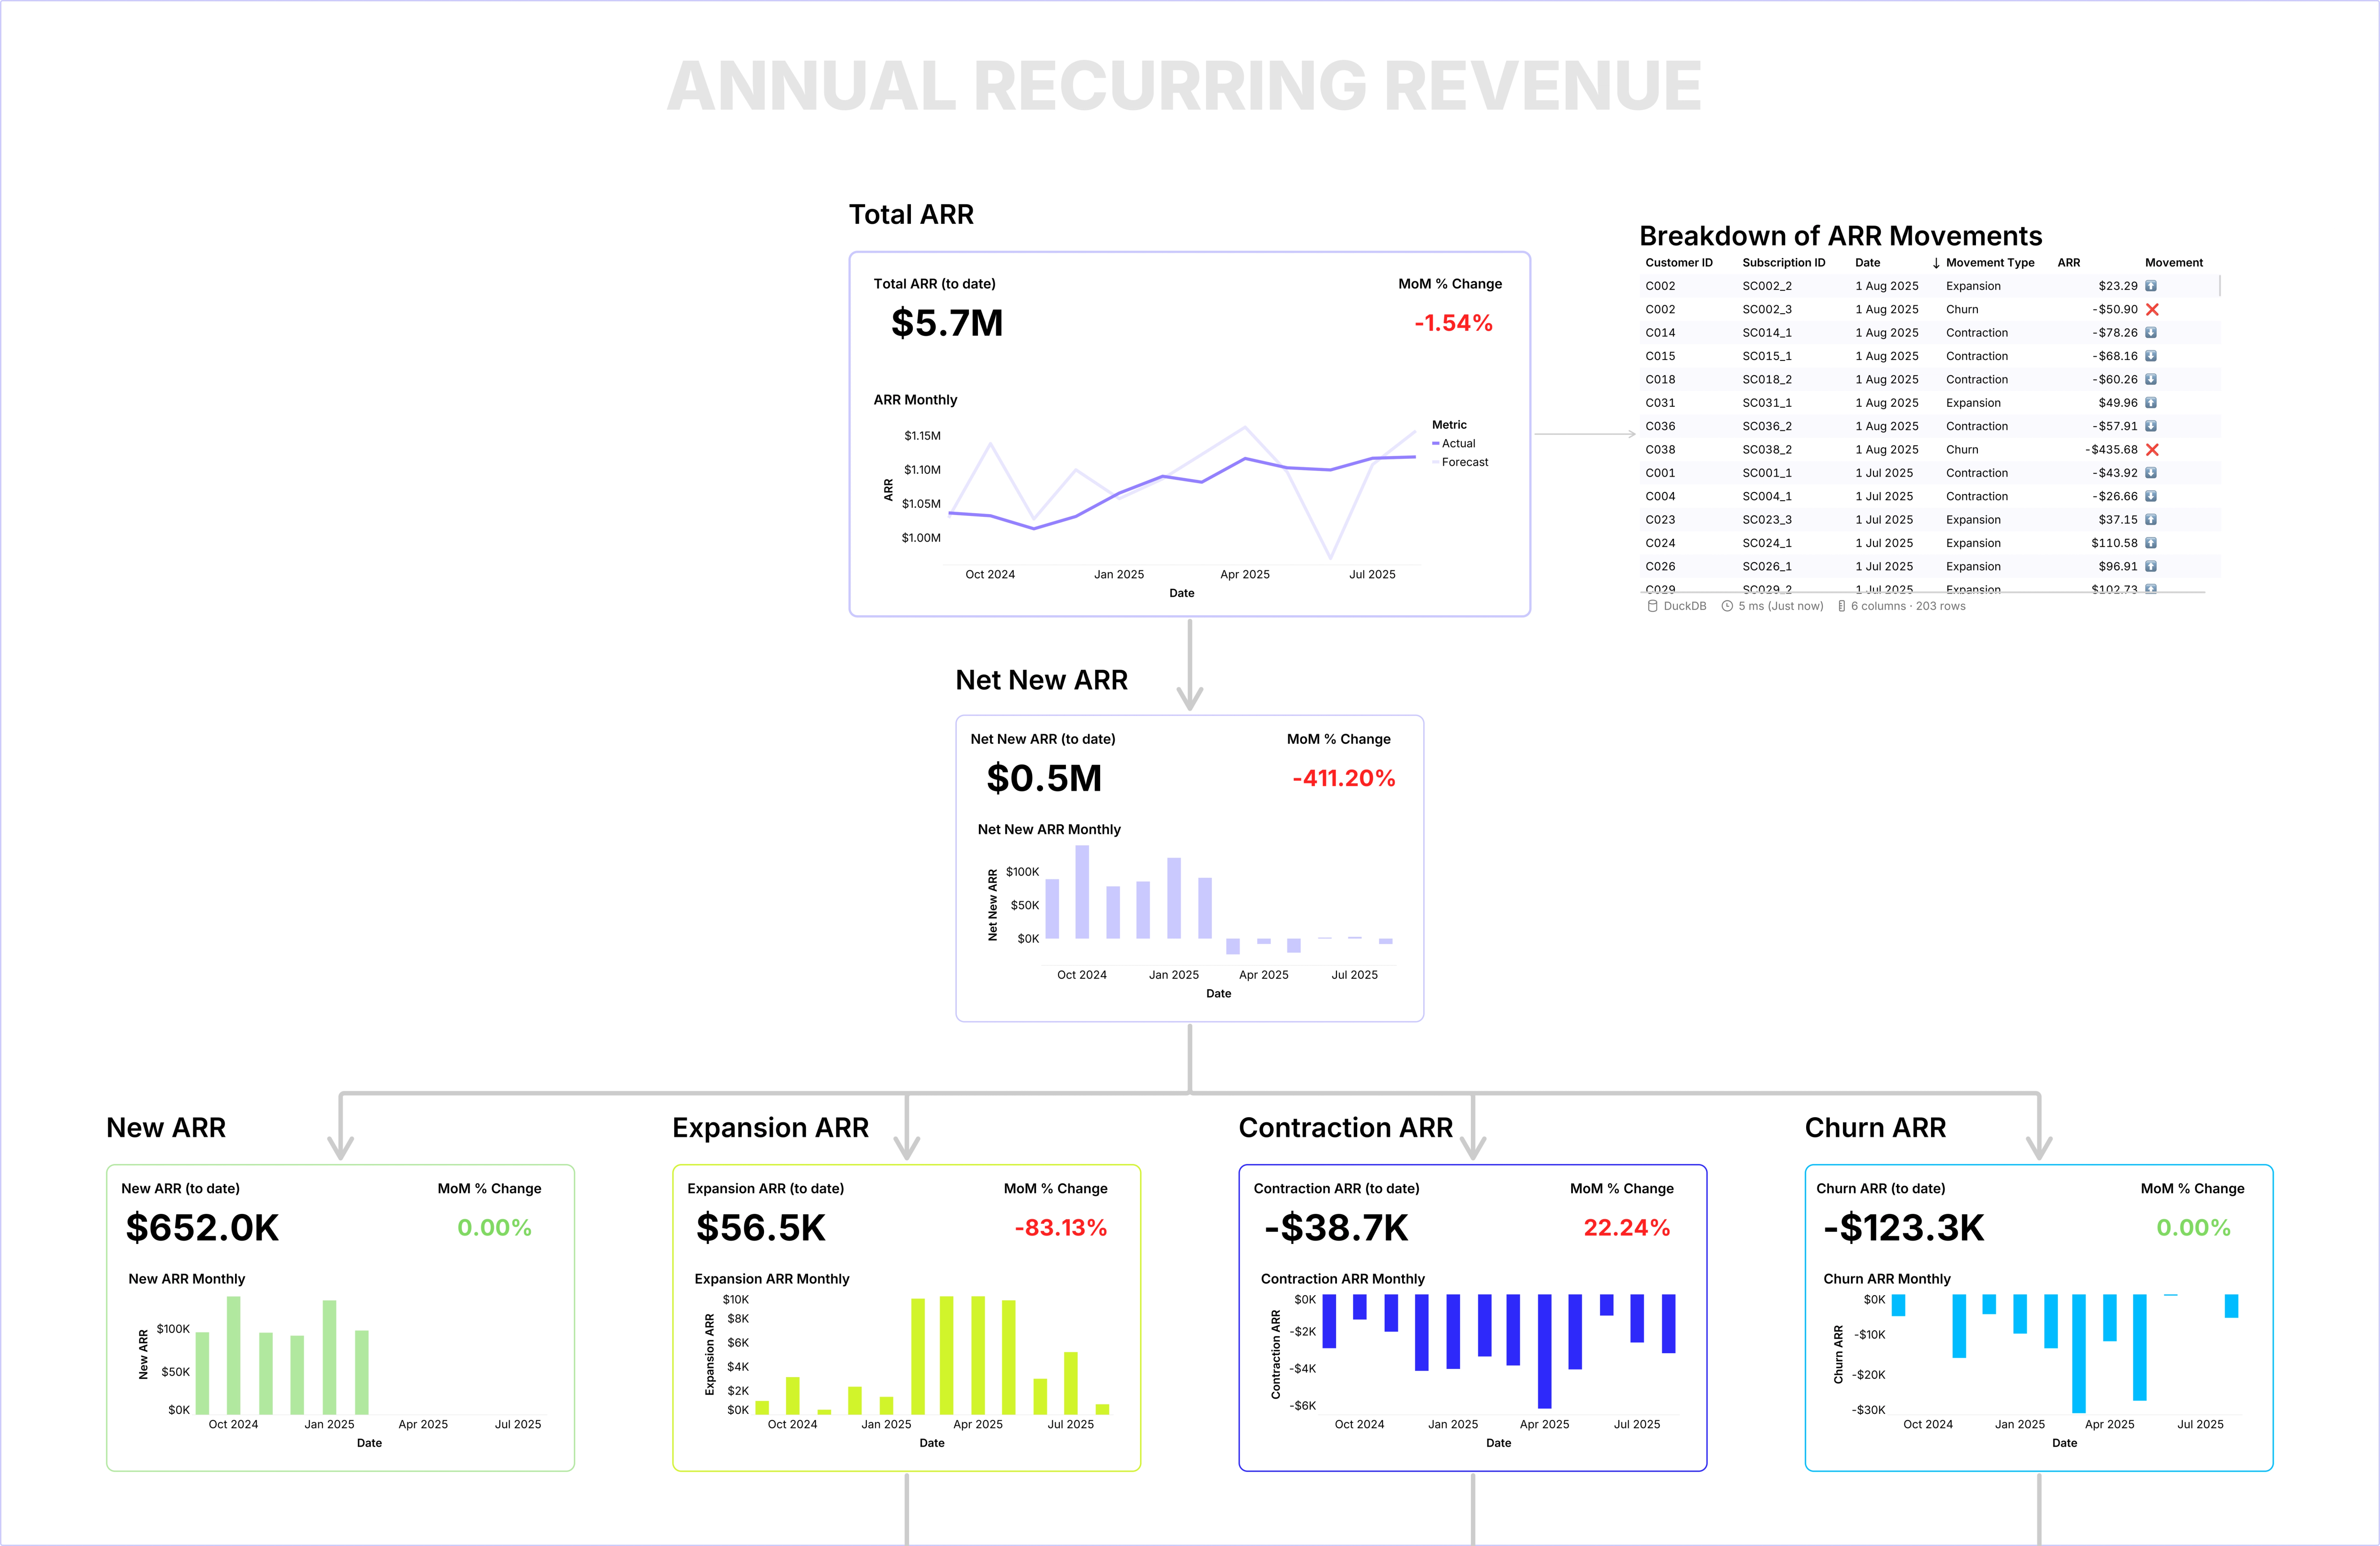
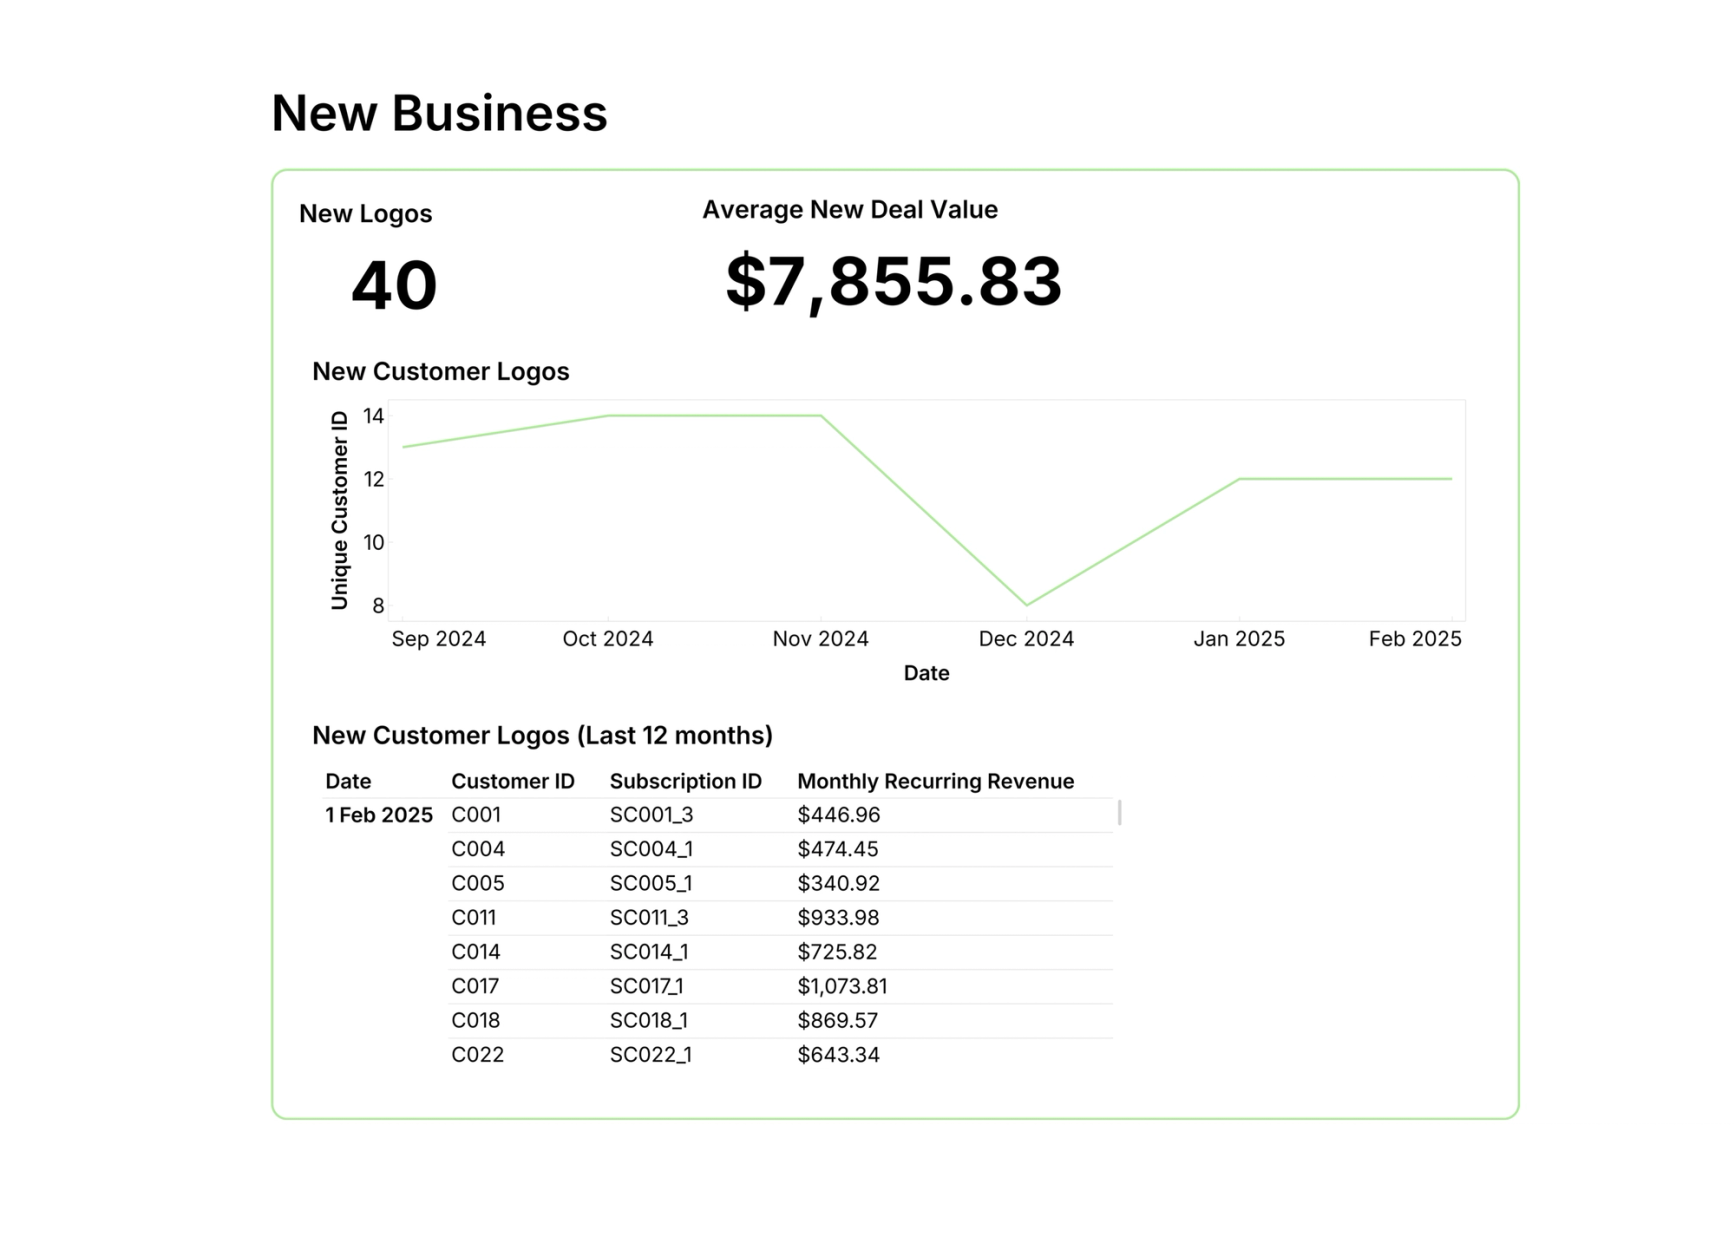
Bring clarity to the most complex parts of your business by making it visible: warts, whats and all.

“Recently, I was building Sales models in dbt to solve a business challenge around how we calculate and pay sales commissions. Once the models were ready, setting up a connection in Count took just a few clicks. I introduced the relevant tables, and from there, our sales team was able to build beautiful dashboards on their own. The ease of use is honestly spectacular. It saved me time, empowered the team to self-serve their data, and reduced the back-and-forth usually involved in reporting. Count has made the handoff between data and business teams feel seamless.”
Metrics you can trust (everyone with)
We've all seen correct numbers used incorrectly spread across organizations in an instant. Count Metrics lets you lock in definitions, presentation formats, and aggregations so your most critical data always adds up as it should.
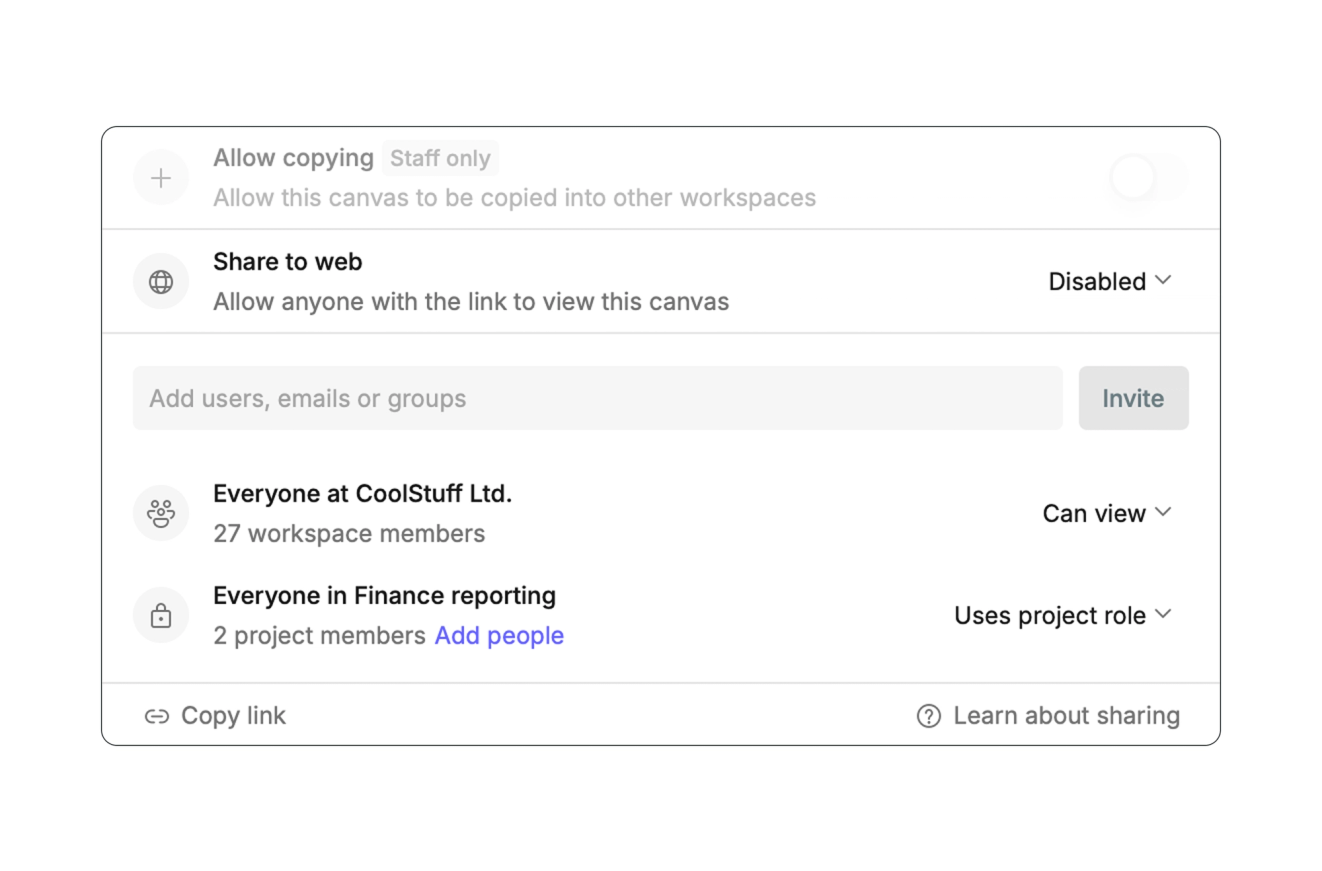
Metrics you trust (fewer people with)
With fine-grain permissions across canvases, projects, and metric catalogs, you can ensure that the only right people can access the right information.
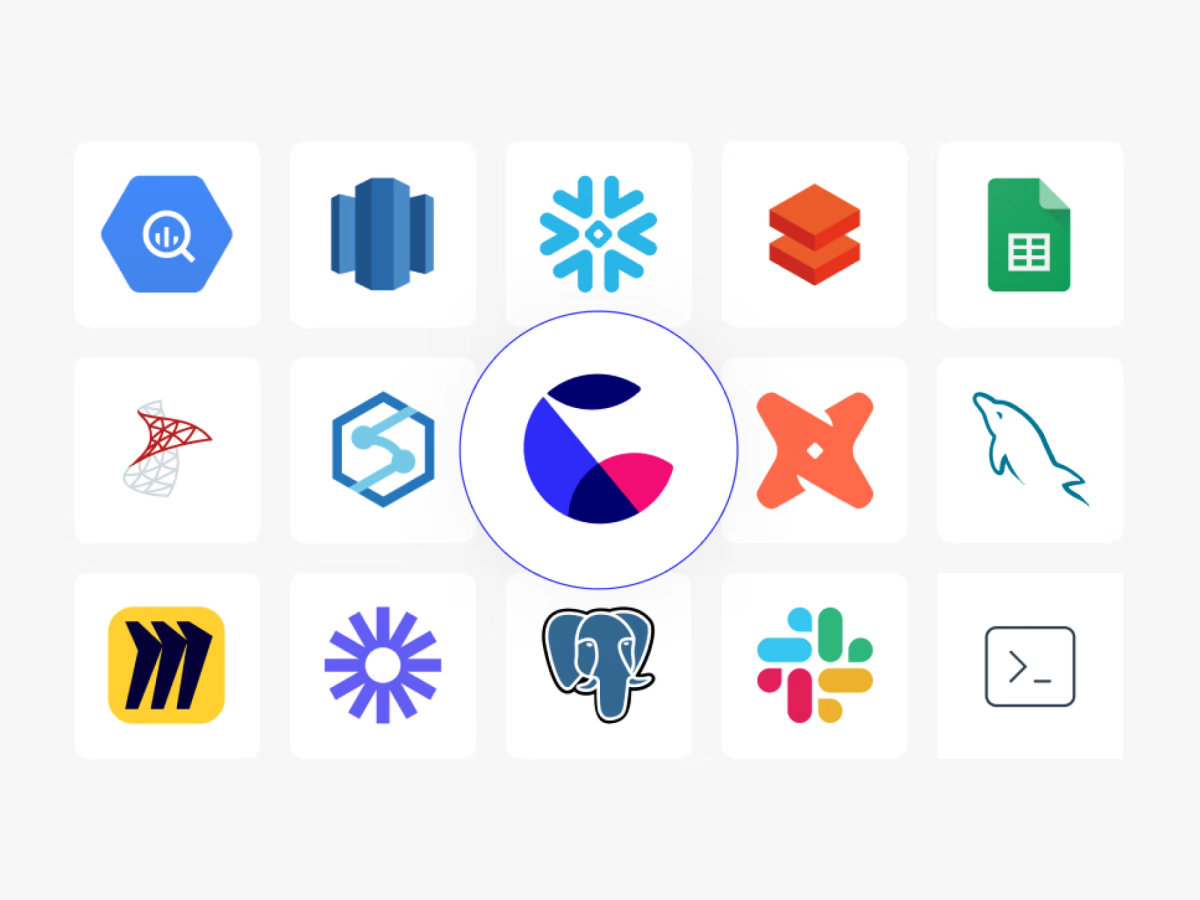
All your data in one place
Connect databases, data warehouses, APIs through Python or just plain old CSVs together in one place. Close some apps, sheets, and tabs, and focus on solving the problems.
Related Resources

Frequently Asked Questions
Yes, through Explorer roles and low-code/visual cells. Explorers can use drag-and-drop functionality on pre-built datasets from Count Metrics (the semantic layer) to create their own analyses without writing SQL, while analysts maintain governance through the semantic layer.
Yes, through project-based permissions, role assignments, and table access restrictions. Admins can control who accesses specific database connections and projects, with granular control from workspace to canvas level.